
To know which parts of the country have the greatest potential for bioeconomic development requires an updated mapping of the volume, quality and location of available resources.
– We are now working on creating a model showing how knowledge of resource availability can be coupled with a set of variables that calculate social utility and cost. For the test region of Østfold we have calculated the biological resources from forestry, says Svein Olav Krøgli, researcher at NIBIO (see the figures at the bottom of this article).
The location of biological resources will play a central role in determining where the potential for developing a bioeconomy is greatest.
– Later in the project we will gather data on the location of cereals, fisheries and so on, but this model provides the foundation for locating places where the economy is closely tied with biological resource utilisation. Technological developments frequently occur in clusters where resources and organisations are located in the same area. This contributes to low costs and maximum efficiency. One such concentration of activities in a “smart” bioeconomy is around factors such as knowledge, resources, supply chains and transport and knowing where these resources are enables us to analyse the optimal use of resources, says Krøgli.
NIBIO and SINTEF are working together to analyse both resource allocation and optimal resource utilization. The mapping approach will provide an important future tool for policy-makers.
– Our aim is to equip policy makers with tools to make the best choices for the benefit of society, says senior researcher at NIBIO, Wenche Dramstad.
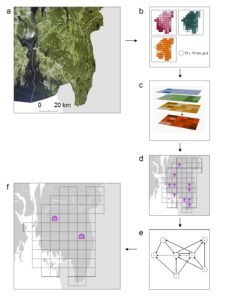
Figure illustration:
- Aerial photograph of the study region.
- Data on biological and other resources. Three resources are displayed using different colours, this could be e.g. forest biomass, transport infrastructure or distance to knowledge facilities. The data are presented in 10 x 10 km spatial units.
- To combine the different map layers the values are scaled to a common reference (e.g. 0-1). We also weight the resource map layers based on their relative importance before combining them in GIS-MCDA.
- Areas are chosen based on their suitability as determined by the model. The selected areas are used as inputs in an operation analysis.
- The operation analysis looks more closely at the potential locations. It considers the economic conditions and flows of resources and products within a cluster and between clusters.
- Location of the best cluster localities. Together with the maps of the distribution of resources the results can contribute to decision support, as well as assessment of the role of geography in the bioeconomy.